how to find standard deviation of grouped data
The standard deviation measures the spread of the data about the mean value. It is useful in comparing sets of data which may have the same mean but a different range. For example, the mean of the following two is the same: 15, 15, 15, 14, 16 and 2, 7, 14, 22, 30. However, the second is clearly more spread out. If a set has a low standard deviation, the values are not spread out too much.
Just like when working out the mean, the method is different if the data is given to you in groups.
This video shows you how to calculate the Standard Deviation.

Non-Grouped Data
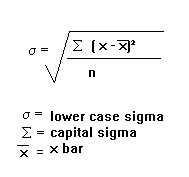
Non-grouped data is just a list of values. The standard deviation is given by the formula:

s means 'standard deviation'.
S means 'the sum of'.
 means 'the mean'
Example
Find the standard deviation of 4, 9, 11, 12, 17, 5, 8, 12, 14
First work out the mean: 10.222
Now, subtract the mean individually from each of the numbers given and square the result. This is equivalent to the (x -  )² step. x refers to the values given in the question.
| x | 4 | 9 | 11 | 12 | 17 | 5 | 8 | 12 | 14 |
(x -  )2 )2 | 38.7 | 1.49 | 0.60 | 3.16 | 45.9 | 27.3 | 4.94 | 3.16 | 14.3 |
Now add up these results (this is the 'sigma' in the formula): 139.55
Divide by n. n is the number of values, so in this case is 9. This gives us: 15.51
And finally, square root this: 3.94
The standard deviation can usually be calculated much more easily with a calculator and this may be acceptable in some exams. On my calculator, you go into the standard deviation mode (mode '.'). Then type in the first value, press 'data', type in the second value, press 'data'. Do this until you have typed in all the values, then press the standard deviation button (it will probably have a lower case sigma on it). Check your calculator's manual to see how to calculate it on yours.
NB: If you have a set of numbers (e.g. 1, 5, 2, 7, 3, 5 and 3), if each number is increased by the same amount (e.g. to 3, 7, 4, 9, 5, 7 and 5), the standard deviation will be the same and the mean will have increased by the amount each of the numbers were increased by (2 in this case). This is because the standard deviation measures the spread of the data. Increasing each of the numbers by 2 does not make the numbers any more spread out, it just shifts them all along.
Grouped Data
When dealing with grouped data, such as the following:
| x | f |
| 4 | 9 |
| 5 | 14 |
| 6 | 22 |
| 7 | 11 |
| 8 | 17 |
the formula for standard deviation becomes:

Try working out the standard deviation of the above data. You should get an answer of 1.32 .
You may be given the data in the form of groups, such as:
| Number | Frequency |
| 3.5 - 4.5 | 9 |
| 4.5 - 5.5 | 14 |
| 5.5 - 6.5 | 22 |
| 6.5 - 7.5 | 11 |
| 7.5 - 8.5 | 17 |
In such a circumstance, x is the midpoint of groups.
how to find standard deviation of grouped data
Source: https://revisionmaths.com/gcse-maths-revision/statistics-handling-data/standard-deviation
Posted by: pellhamshoulmons.blogspot.com

0 Response to "how to find standard deviation of grouped data"
Post a Comment